What is Cash In The Box? Probably the most profitable, reliable and geometric stock chart pattern. The easiest geometric pattern to recognize on a stock chart is a rectangle. Whatever trend was in place before the rectangle formed is likely to continue once the stock breaks out of the rectangle. Rectangles are a kind of holding pattern once a stock has run up, or run down, kind of like treading water. A stock gets stuck in a trading range between price support on the bottom line and price resistance on the top line. It represents a base of demand support on the bottom price and selling resistance on the top price and the stock vasilates between the two forming a rectangle, or range. When the stock finally breaks out of the box it represents a lucrative trading opportunity, usually an explosive opportunity. That's why my mentor's, Jon Wirrick, his mentor brother, Steve Wirrick, calls them a Cash-In-The-Box. I highly recommend Steve's book, High Octane Trading if you are interested in trading stocks and options for making serious money. What a great way to finance an RV lifestyle with today's mobile internet and online brokers. And it takes only a small amount to get started if you use options.
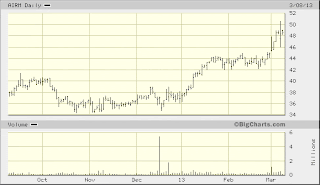
A great example of a Cash-In-The-Box from earlier this week: would be the AIRM Chart . AIRM traded in a flat range from Jan. 17th 2013 to Feb. 28th 2013. On March 1st 2013 it broke out on a heavy volume spike. It traded the next morning from $45.64 and continued up to $50.56 before backing off for a breather today. I like to use Gary B. Smith's strategy when trading breakouts. So one would buy at market at the open the morning following the breakout.$45.64 with a 10% goal for the move, of about $4.50 ish. The protective stop would be just below the breakout line at about $44.75. Set your stocks or options to sell once the stock reaches the apx. 10% gain at about $50. The gain was reached yesterday March 7th, 2013, so the sale was triggered for a gain on stock of about $4.36 or better. April $45 call options were about $2.40 and once the stock moved would have sold for about $5 for a gain of about $2.60 per share. So for an investment of $240 in call options you could have made a gain of $260 more than doubling your cash. You can see the beauty of options for leverage on a small investment/risk. Later this evening or weekend I will post my next Cash-In-The-Box breakout to trade Monday, March 11th, 2013. Let's paper trade these over the next few weeks to see how they do. Gary B. Smith said his average with this kind of play was about 80% winners over losers. Check back later to get the next breakout plays for Monday morning. I will be doing my picking probably this evening after the market is closed.
This setup looks likely as Cash-In-The-Box breakout and buy for Monday morning.
ABAX
Friday, March 8, 2013
Subscribe to:
Post Comments (Atom)


Please note the appreciation target for any breakout price would be a 5% gain not a 10% gain as I posted here.
ReplyDelete